
Via Gawker, here's the origin of this map (one in a series) and what the colors mean:
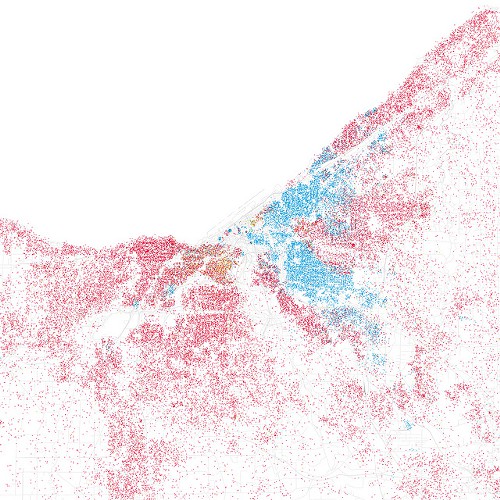
Recently, cartographer Bill Rankin produced an astounding map of Chicago, which managed to show the city's areas of racial integration.Eric Fischer saw those maps, and took it upon himself to create similar ones for the top 40 cities in the United States. Fisher used a straight forward method borrowed from Rankin: Using U.S. Census data from 2000, he created a map where one dot equals 25 people. The dots are then color-coded based on race: White is pink; Black is blue; Hispanic is orange, and Asian is green.
While, not unexpectedly, Cleveland's east side shows the largest concentration of non-whites while the west side is pretty lily-white, it's still interesting to see it laid out visually.
